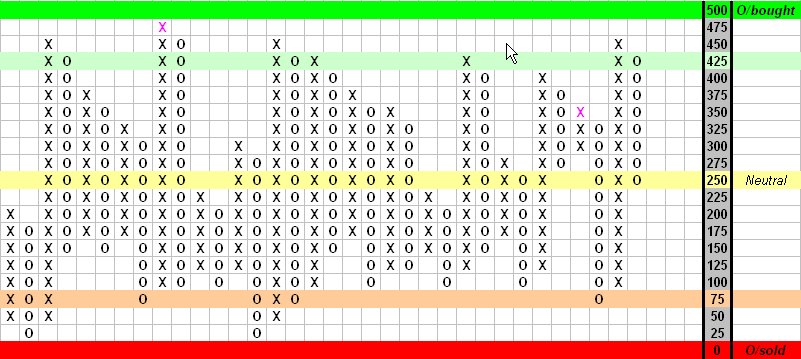
Going into the CIT date the market is right in the middle of the overbought/oversold range.
The indicator is displayed in a P&F format just because it makes it more intuitive and comprises the same elements as the overbought/oversold oscillator displayed at the beginning of this blogg.
The preferred scenario going forward is a pull-back into September 19th, a rally into the 22nd, and another turn.
I should note that a CIT doesn't have numeric characteristics; i.e. when a CIT comes it doesn't mean that the index should drop or jump a certain minimum number of percentage points. Rather, it means that if the index was moving up to that point, it should now move sideways or down, and vice versa -- if the market was flat it should move up or down. Whether the move will be strong or weak is determined by the overbought/oversold nature of the market going into the CIT date, and the time-span before the next CIT date.
