
The purpose of this blog is to use cycle analysis to identify future Change in Trend (CIT) or swing dates for the US indices.
Most of the technical analysis work will be done using proprietary tools and methods developed during the last 10+ years.
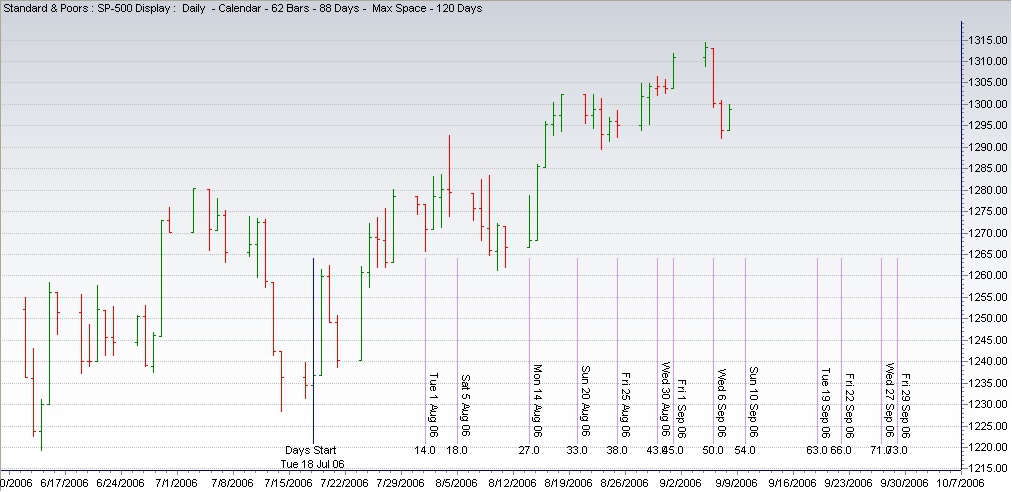
The SPX will be used as a proxy, although the original work is done on a different set of data.
The analysis should be of best use for futures, options or ETF traders.
Comments for the week of September 11th.
There is one CIT date for this period, and it actually falls on Sept. 10th.
This, right from the beginning, illustrates one of the problems that inevitably will be encountered with this type of analysis -- some of the CIT dates will fall on weekends or public holidays. However, it shouldn't be of much concern, since once we know that a change in trend is imminent, the problem boils down to whether to act before or after the CIT date, or even both.
In solving this problem, I use a particular type of oscillator, which tells me whether the market is oversold or overbought going into the CIT date.
The screencapture shows this indicator in action.
Therefore, I think that this is one of those cases when it's best to take half a position before the CIT date, and half a position on any weakness after the CIT date.
The next CIT date is September 19th.
Good luck.
