A lot of ground to cover today.
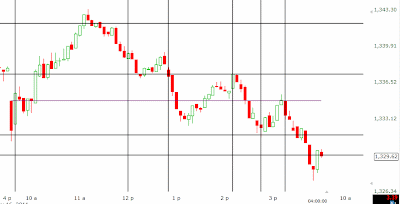
Let's start with GE first, with the support/resistance levels given this morning, which nailed both the top and the bottom:
Next we proceed with the SPX matrix i.e. S/R Levels + Intraday CITs (for the CITs allow +/- 5 min):
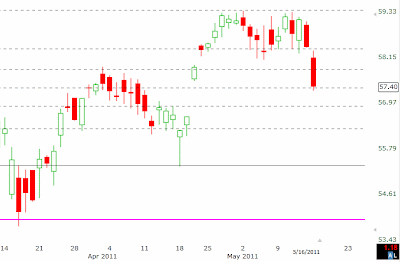
And the SPX daily, still flirting with S1:
There was noticeable divergence with Buy Volume
Most likely due to the fact that the sell-off was accompanied with rotation out of certain industry groups into others. Which brings me to the Qs, and the monster gap left on April 20th:
Market Breadth Data******************************
Monday, May 16, 2011
Terms of Use
All rights reserved by the author. The material contained herein is original content and is the sole property of the author. Any commercial use or reproduction - either in part or whole - is strictly forbidden without the author's prior consent.
Disclaimer: The information provided here is for educational purposes only and does not constitute trading advice nor an invitation to buy or sell securities. The views are the personal views of the author. Before acting on any of the ideas expressed, the reader should seek professional advice to determine the suitability in view of his or her personal circumstances.


