Market Breadth Data******************************

Wednesday, November 29, 2006


These are the CIT dates for December.

The key levels to watch today are 1393 and 1793 basis the futures.

There will be a more extensive update over the week-end.

Saturday, November 25, 2006


Two weeks ago I spoke about the interaction between the CIT dates and the Overbought/Oversold (OB/OS) indicator. Last week was a textbook example of how they complement each other.

The OB/OS indicator reached its peak on 11/16. However, the SPX registered its highest reading on 11/22 just as anticipated by the CIT date. Since OB/OS has been deteriorating for several days now, it has already reached oversold levels.

I took the liberty of extending the chart above by 1 day to point out where the indicator will be on Monday if the Friday sell-off continues. Considering that 11/27 is a CIT date, I would presume that the lows on Monday will provide a good swing trade entry point.

Friday, November 24, 2006


The chart above begs the question: what are the odds of the index closing exactly at a cardinal Sq9 number, on a CIT date, and squaring in time and price with the 01/14/03 high, which has contained the current rally several times already?

Sunday, November 19, 2006


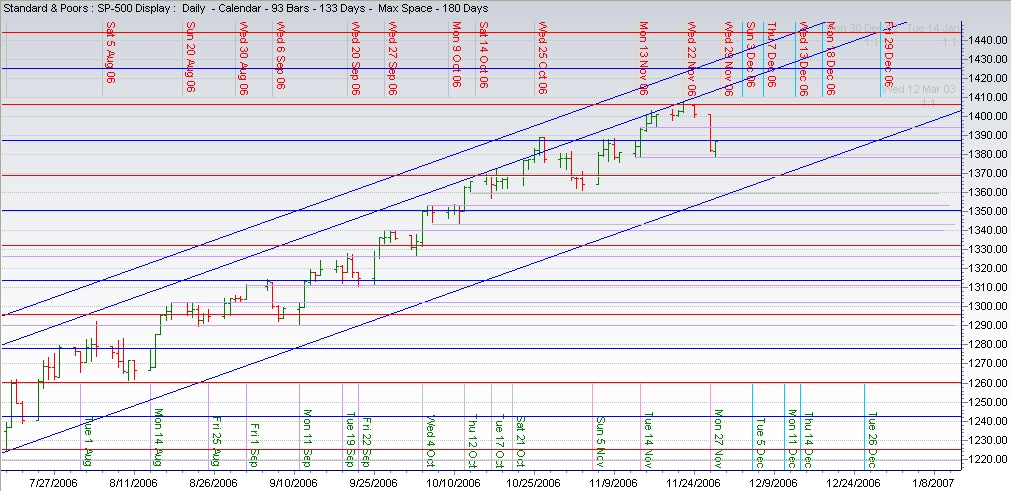
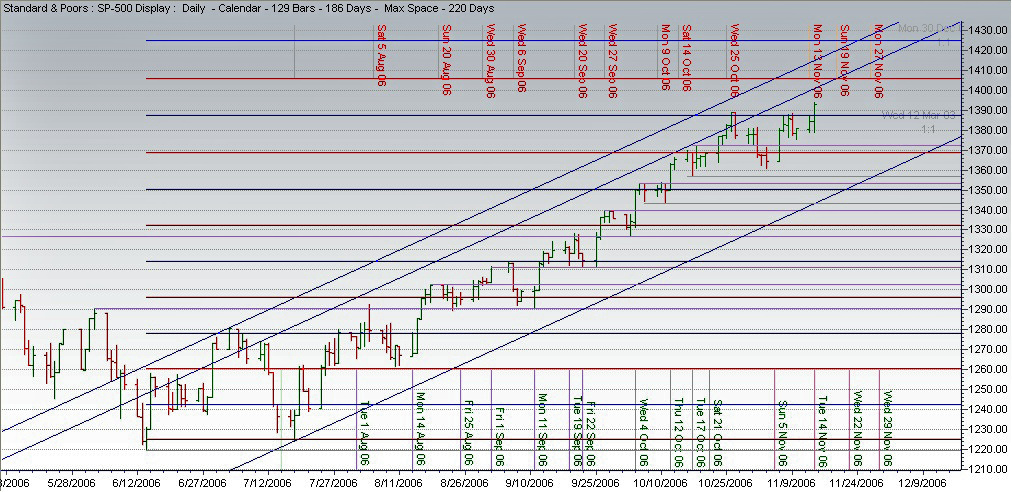
There are no changes this week, neither in the daily nor weekly signals.
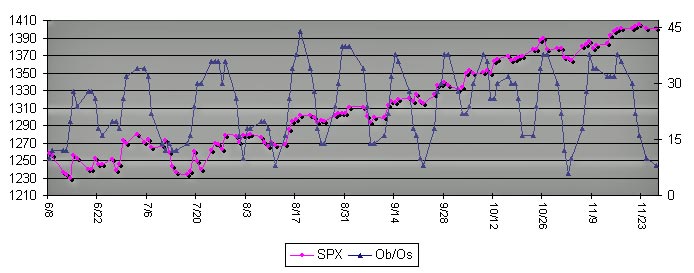
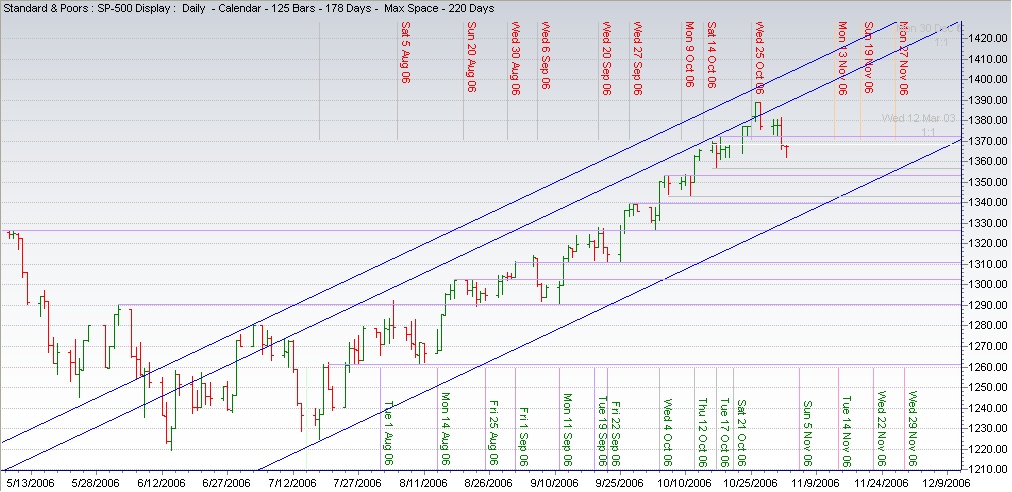
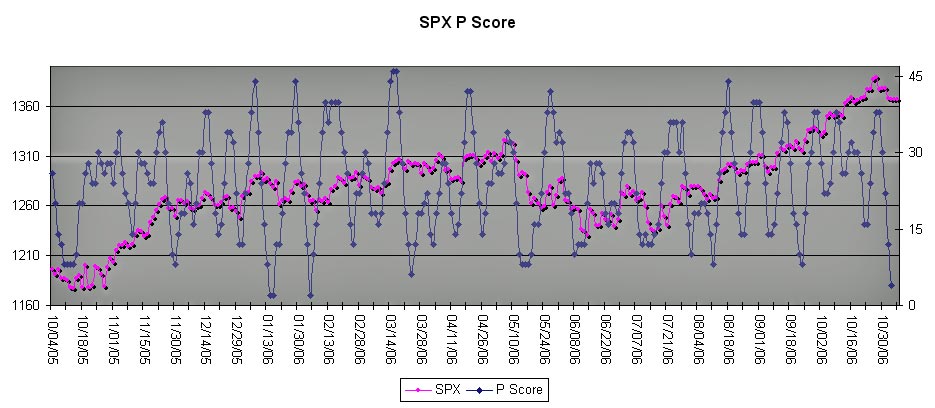
My major concern is that, judging by the Overbought/Oversold indicator, there doesn’t seem to be much upward potential between now and the next CIT date on Nov. 22nd.

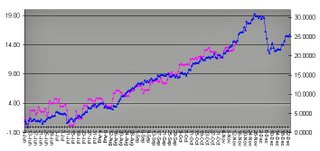
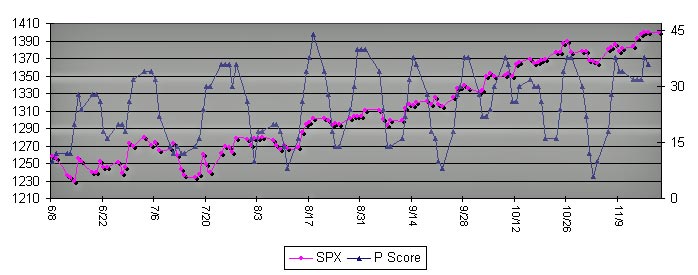
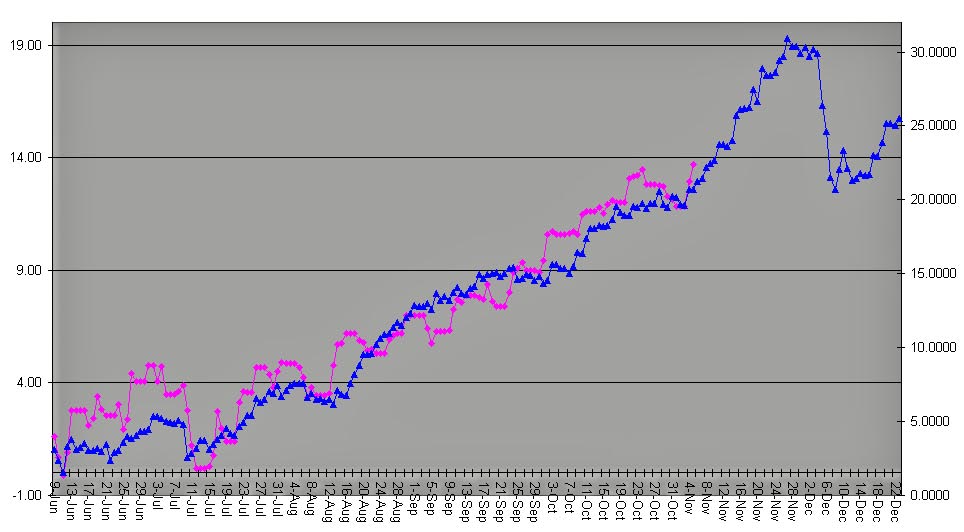
I’ve also updated the correlation chart, and everything is still in gear.

Action in today’s markets is not out of line with the past. For the period January-November the DJIA is exhibiting better than .9 correlation with 7 of the last 126 years. For the period June-November the number more than doubles to 15. Both composite correlation charts point to a sell-off in December. Does this mean that in 2006 the markets must go up until the first week of December, and then have a sizeable correction? Not necessarily, although it’s worth keeping in mind as a potential outcome.

Tuesday, November 14, 2006


Here's an update with all the relevant dates and
suport/resistance lines.

I've also included two more calendars to follow a mechanical Buy/Sell system which tends to capture the larger swings. For the most recent weekly signal you need to scroll back to July '06

Sunday, November 12, 2006


Surprise, there were neither higher highs, nor lower lows, and instead, the SPX just tagged last week highs. So, we should give the current trend the benefit of the doubt. Therefore, keep on watching for a movement above or below the support/resistance lines and channels, as suggested before.

Considering this is opex week, I would interpret the next two CIT dates as marking the usual option player shakeout, and then a fizzle for the rest of the week.

I’ve made frequent references to my Overbought/Oversold (“OB/OS”) Indicator. It is a mixed leading/coincidental indicator. At times it enables me to predict several days in advance when the market will lose or gather steam either on the upside or the downside. It’s been very gratifying to see how well this indicator works together with the CIT dates. The chart above makes the point.

I’ve also included the results from a mechanical long/short trend-following system which I like to keep an eye on.

Wednesday, November 08, 2006


Here's another set of support/resistance levels.

Monday, November 06, 2006


This is the updated version of the correlation chart from 10.14th.

Friday, November 03, 2006


The good news is: the CIT dates are working just fine.

The problem is: I got wrapped up in my mechanical hi-lo-hi-lo sequence and ignored the possibility of 2 highs or lows in a row, which has in fact occurred once before.

In any case that changes the whole outlook. Considering that the market is currently getting oversold, November 5 – 13th the SPX should move sideways/up.
The key to watch is whether we have a higher or lower high during that period.


Terms of Use

All rights reserved by the author. The material contained herein is original content and is the sole property of the author. Any commercial use or reproduction - either in part or whole - is strictly forbidden without the author's prior consent.

Disclaimer: The information provided here is for educational purposes only and does not constitute trading advice nor an invitation to buy or sell securities. The views are the personal views of the author. Before acting on any of the ideas expressed, the reader should seek professional advice to determine the suitability in view of his or her personal circumstances.