Market Breadth Data******************************

Saturday, November 25, 2006


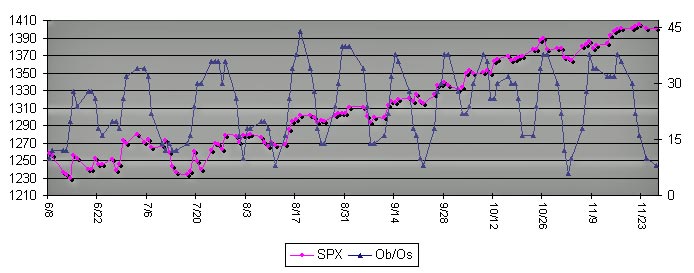
Two weeks ago I spoke about the interaction between the CIT dates and the Overbought/Oversold (OB/OS) indicator. Last week was a textbook example of how they complement each other.

The OB/OS indicator reached its peak on 11/16. However, the SPX registered its highest reading on 11/22 just as anticipated by the CIT date. Since OB/OS has been deteriorating for several days now, it has already reached oversold levels.

I took the liberty of extending the chart above by 1 day to point out where the indicator will be on Monday if the Friday sell-off continues. Considering that 11/27 is a CIT date, I would presume that the lows on Monday will provide a good swing trade entry point.

Terms of Use

All rights reserved by the author. The material contained herein is original content and is the sole property of the author. Any commercial use or reproduction - either in part or whole - is strictly forbidden without the author's prior consent.

Disclaimer: The information provided here is for educational purposes only and does not constitute trading advice nor an invitation to buy or sell securities. The views are the personal views of the author. Before acting on any of the ideas expressed, the reader should seek professional advice to determine the suitability in view of his or her personal circumstances.