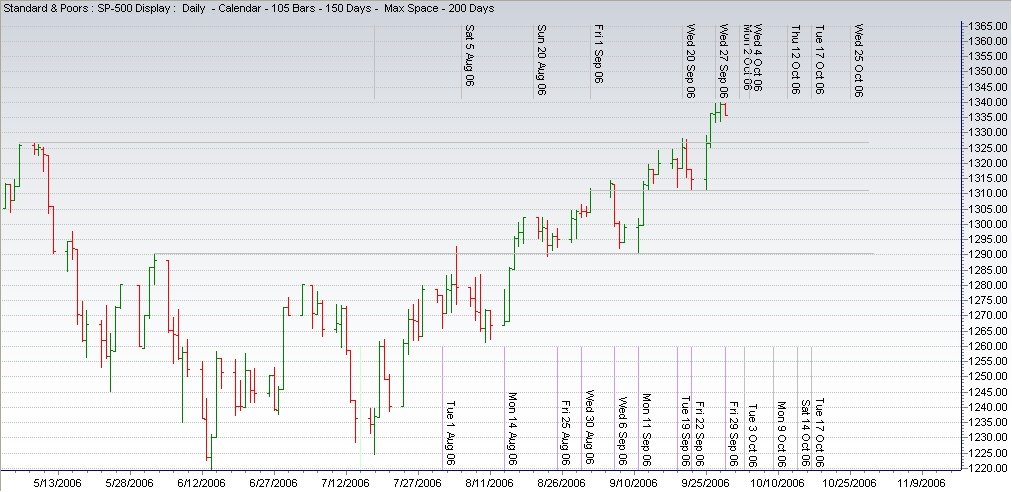
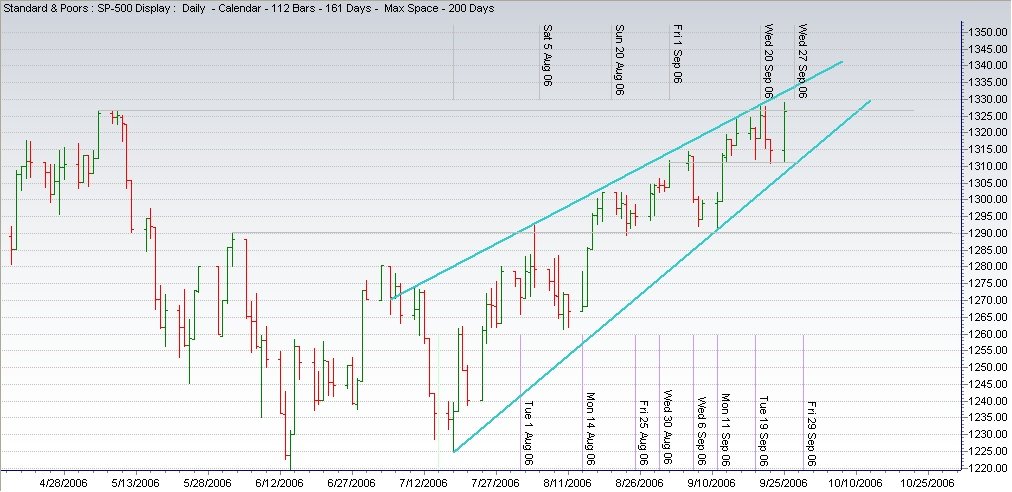
Here are my CIT dates for October.
You'll notice the cluster of dates October 2nd - 4th.
If prior history is any indication, it tells me that the market will remain choppy within this time frame before a new trend reasserts itself.
What better way to mark the EOM and EOQ than with a new all-time high for the DJIA?
That's what I expect to happen on this last for September CIT date.
In the meantime, the index is getting overbought, but there is still room for one more push up.
Early October should offer some interesting opportunities....
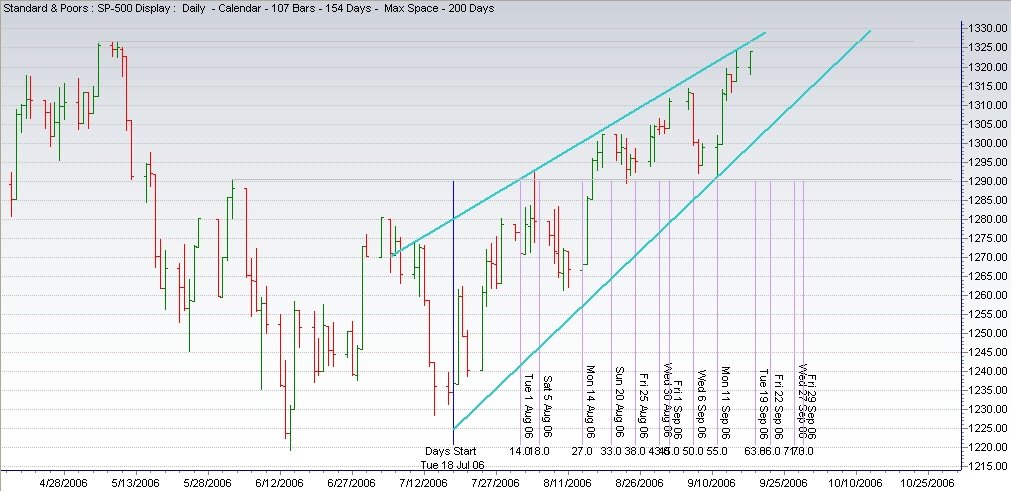
Yesterday's rejection at resistance, accompanied with negative divergence in market internals, was a clear sign that the uptrend is in trouble.
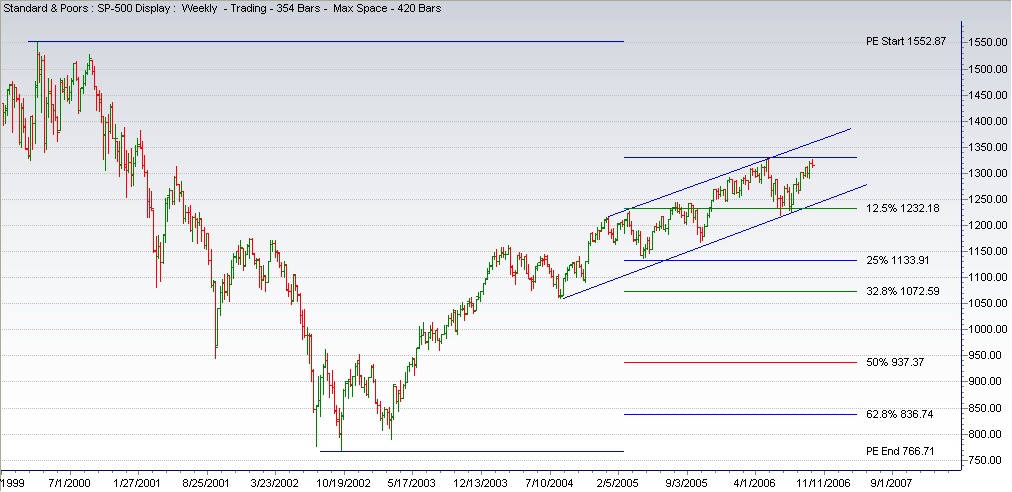
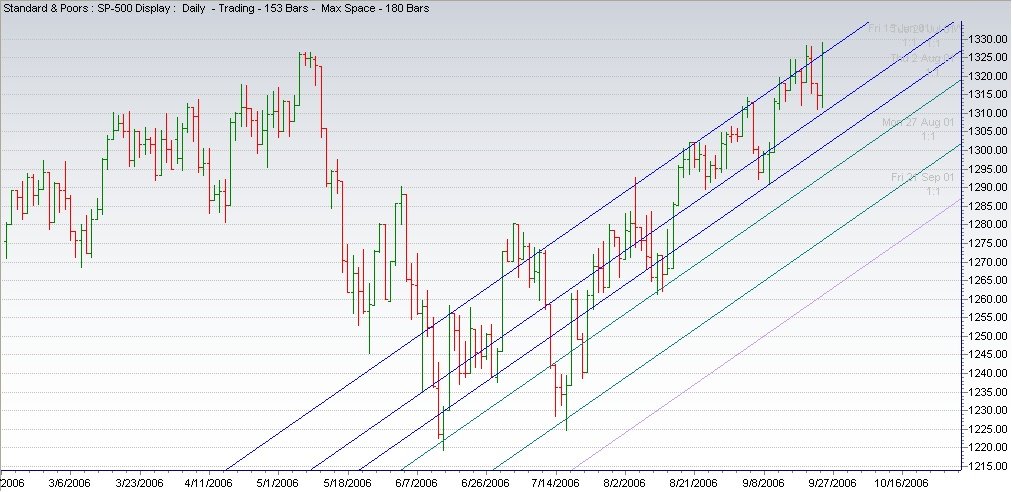
From a classic TA point of view, the SPX is confined by the boundaries of the rising wedge and resistance from the May 8th high.
From a Gann perspective, the index is still controlled by the Zero lines from May 2001. Resistance is at 1325, while support is at 1310 and 1303. These numbers increase by 1 point per TD.
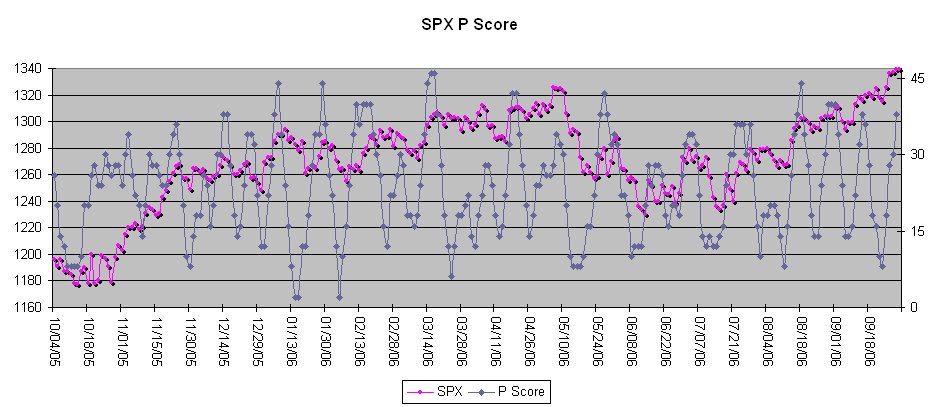
In my preferred scenario I missed again the September 20th CIT date. I guess my subconscious is unwilling to accept that date. When taken into consideration, however, it defines the action so far pretty well, and points to Sept. 22nd as a low. Wouldn't that come as a surprise to many?
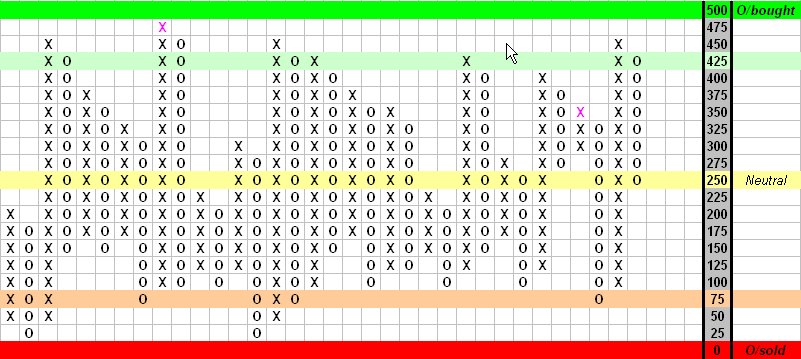
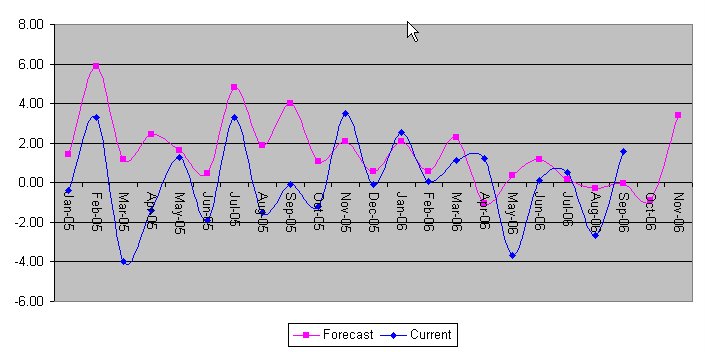
The indicator is displayed in a P&F format just because it makes it more intuitive and comprises the same elements as the overbought/oversold oscillator displayed at the beginning of this blogg.
The preferred scenario going forward is a pull-back into September 19th, a rally into the 22nd, and another turn.
I should note that a CIT doesn't have numeric characteristics; i.e. when a CIT comes it doesn't mean that the index should drop or jump a certain minimum number of percentage points. Rather, it means that if the index was moving up to that point, it should now move sideways or down, and vice versa -- if the market was flat it should move up or down. Whether the move will be strong or weak is determined by the overbought/oversold nature of the market going into the CIT date, and the time-span before the next CIT date.

Most of the technical analysis work will be done using proprietary tools and methods developed during the last 10+ years.
The SPX will be used as a proxy, although the original work is done on a different set of data.
The analysis should be of best use for futures, options or ETF traders.
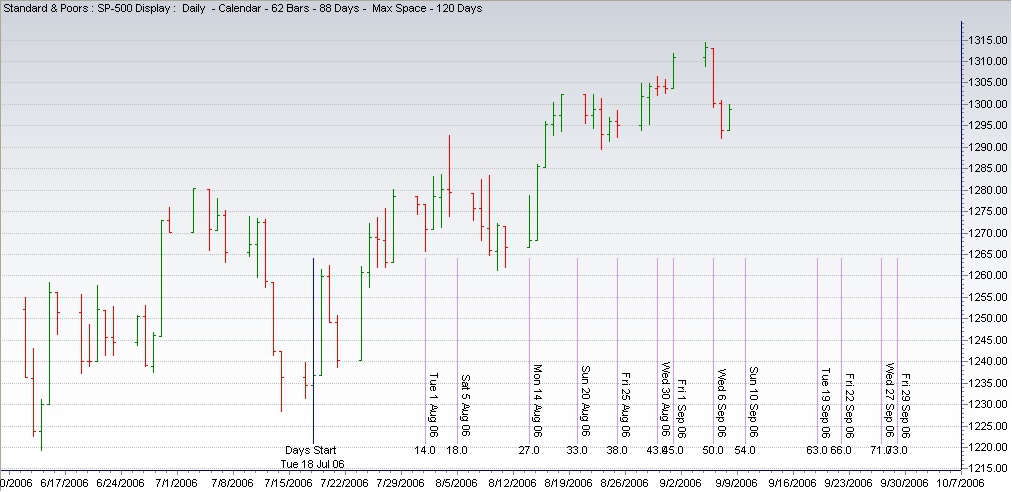
Comments for the week of September 11th.
There is one CIT date for this period, and it actually falls on Sept. 10th.
This, right from the beginning, illustrates one of the problems that inevitably will be encountered with this type of analysis -- some of the CIT dates will fall on weekends or public holidays. However, it shouldn't be of much concern, since once we know that a change in trend is imminent, the problem boils down to whether to act before or after the CIT date, or even both.
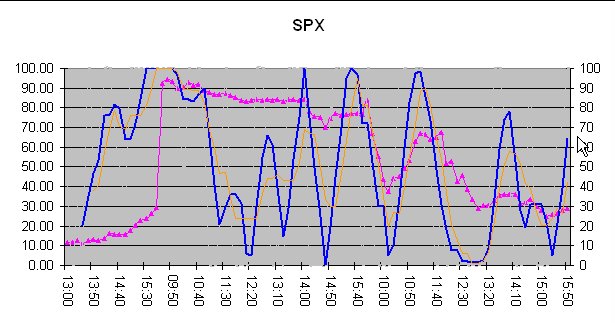
In solving this problem, I use a particular type of oscillator, which tells me whether the market is oversold or overbought going into the CIT date.
The screencapture shows this indicator in action.


