Market Breadth Data******************************

Saturday, November 29, 2008

It would be really surprising, and a real show of strength, if this rally continues uninterrupted next week:


Wednesday, November 26, 2008

The OEX and SPX getting overbought, on low volume, ahead of the next G date:


The SPX map for today:


Note: allow +/-1 bar for the cycles to begin/end.

Tuesday, November 25, 2008

Here's a shot of key levels and times for today:


Monday, November 24, 2008

Sunday, November 23, 2008

There is no reason why support/resistance levels can't be combined with key intraday cycles:


Plus an update of some older charts:


Friday, November 21, 2008

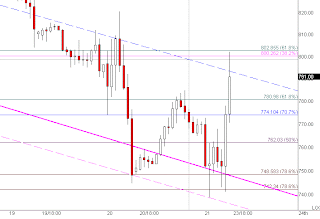
A few intraday support/resistance zones at the open:


and after the close:

Thursday, November 20, 2008

Wednesday, November 19, 2008

Here's the follow-up to the last target projection:


and a new one, that brings the 2002 low into play:


Tuesday, November 18, 2008

Monday, November 17, 2008

Here are some additional targets, should support levels fail:


Friday, November 14, 2008

The process of testing important support levels continues:


Thursday, November 13, 2008

Yet another pre-opex classic:


But then, again, there may be something else in play:


Wednesday, November 12, 2008

Saturday, November 08, 2008

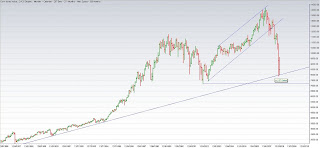
This is an update of an old favorite of mine, and a summary of the bear campaign for SPX and the NYSE Composite:


Along with a 5 min. e-mini chart as a bonus:

Friday, November 07, 2008

Here's what happened on prior occasions following two days of 5% declines for the Dow:

1940: day1 .62%, day5 -11%, day 30 -4.68%

1933: 6.31%, 6.57%, 12.97%

1932: 5.5%, 8.55%, 11.97%

1932: .45%, 6.26%, -.62%

1929: 9.36%, 20%, 25%

Thursday, November 06, 2008

As far as I can tell, there have been only 7 back to back 5% and greater declines in the last 100 years of Dow history. The first six occurred in the period 1929-1940.

The only triple marked the '29 bottom on November 13th, 19229.

To put things in perspective, this is how overbought certain indicators were on November 4th:


Wednesday, November 05, 2008

The answer to my question from last week was hidden in plain sight in the calendar on the left.

Below is a review of the H&S targets posted last month.
Two out of three ain't bad:


Terms of Use

All rights reserved by the author. The material contained herein is original content and is the sole property of the author. Any commercial use or reproduction - either in part or whole - is strictly forbidden without the author's prior consent.

Disclaimer: The information provided here is for educational purposes only and does not constitute trading advice nor an invitation to buy or sell securities. The views are the personal views of the author. Before acting on any of the ideas expressed, the reader should seek professional advice to determine the suitability in view of his or her personal circumstances.