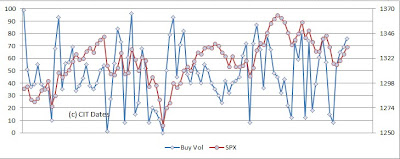
Now here's an interesting chart to consider:
The blue line is the daily trend summary, found on p. 23 of Trading the SP500, while the second line shows the actual SPY performance for May.
FYI, the summary for June can be found on p.46
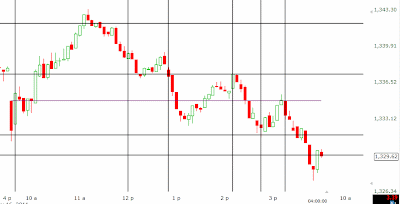
Below is MCD at the close:
Missed the low by a penny this time.
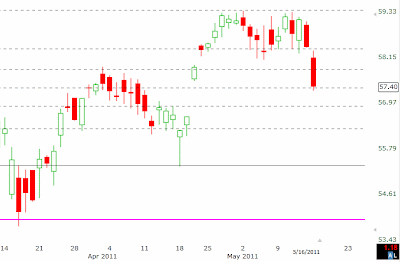
The chart below is a text book example of the ability of the "price motion model" to resolve chart patterns (J.M.Hurst, The Profit Magic of Stock Transaction Timing, pp.51 & 57):
MCD double bottom of Jan-Mar 2011.
Market Breadth Data******************************
Saturday, May 28, 2011
Friday, May 27, 2011
Wednesday, May 25, 2011
Monday, May 23, 2011
Sunday, May 22, 2011
This is a quick note, just to point out the difference between the Risk/Reward (R/R) Oscillator and traditional oscillators, found in most charting packages.
The traditional oscillator can remain overbought/oversold in strong trending markets for a long time, giving you a lot of false signals.
The R/R Osc., by contrast, remains oversold in uptrends, and overbought in downtrends, giving you clues when to pyramid up or down.
The traditional oscillator can remain overbought/oversold in strong trending markets for a long time, giving you a lot of false signals.
The R/R Osc., by contrast, remains oversold in uptrends, and overbought in downtrends, giving you clues when to pyramid up or down.
Friday, May 20, 2011
Thursday, May 19, 2011
Wednesday, May 18, 2011
I just received a question whether HPQ is a buy here, which made me realize, that now is a good time to reiterate how to interpret the charts and data presented on this blog.
As the disclaimer on the left clearly states, there are no trade recommendations given.
Different people trade different strategies and timeframes and one size does not fit all.
As a rule of thumb, for swing and countertrend traders, price penetration of one of the channels should be an indication to consider trades in the opposite direction.
The pivot line should provide trend followers with a guidance when to consider long/short positions.
The Long/Short risk/reward ratios, and the Risk/Reward Oscillator should give all types of traders and idea whether the odds favor the long or short side.
The daily pivots should provide not only day-traders, but long term traders and investors alike with clues where to place their buy/sell and stop/loss orders in order to maximize results.
Ultimately, however, the trading decision rests with the trader/investor himself, and depends entirely on his/her circumstances. Trading is a game of odds, and there are no sure things.
This is not a black box system that spits out buy/sell recommendations, merely a tool aiming to help traders make informed decisions.
Tuesday, May 17, 2011
Monday, May 16, 2011
A lot of ground to cover today.
Let's start with GE first, with the support/resistance levels given this morning, which nailed both the top and the bottom:
Next we proceed with the SPX matrix i.e. S/R Levels + Intraday CITs (for the CITs allow +/- 5 min):
And the SPX daily, still flirting with S1:
There was noticeable divergence with Buy Volume
Most likely due to the fact that the sell-off was accompanied with rotation out of certain industry groups into others. Which brings me to the Qs, and the monster gap left on April 20th:
Subscribe to:
Posts (Atom)
Terms of Use
All rights reserved by the author. The material contained herein is original content and is the sole property of the author. Any commercial use or reproduction - either in part or whole - is strictly forbidden without the author's prior consent.
Disclaimer: The information provided here is for educational purposes only and does not constitute trading advice nor an invitation to buy or sell securities. The views are the personal views of the author. Before acting on any of the ideas expressed, the reader should seek professional advice to determine the suitability in view of his or her personal circumstances.


