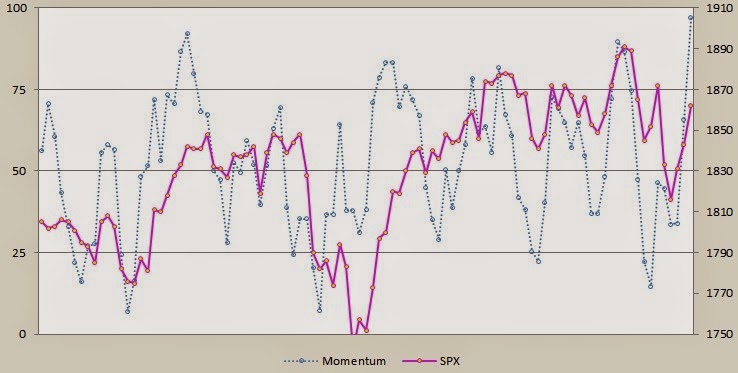
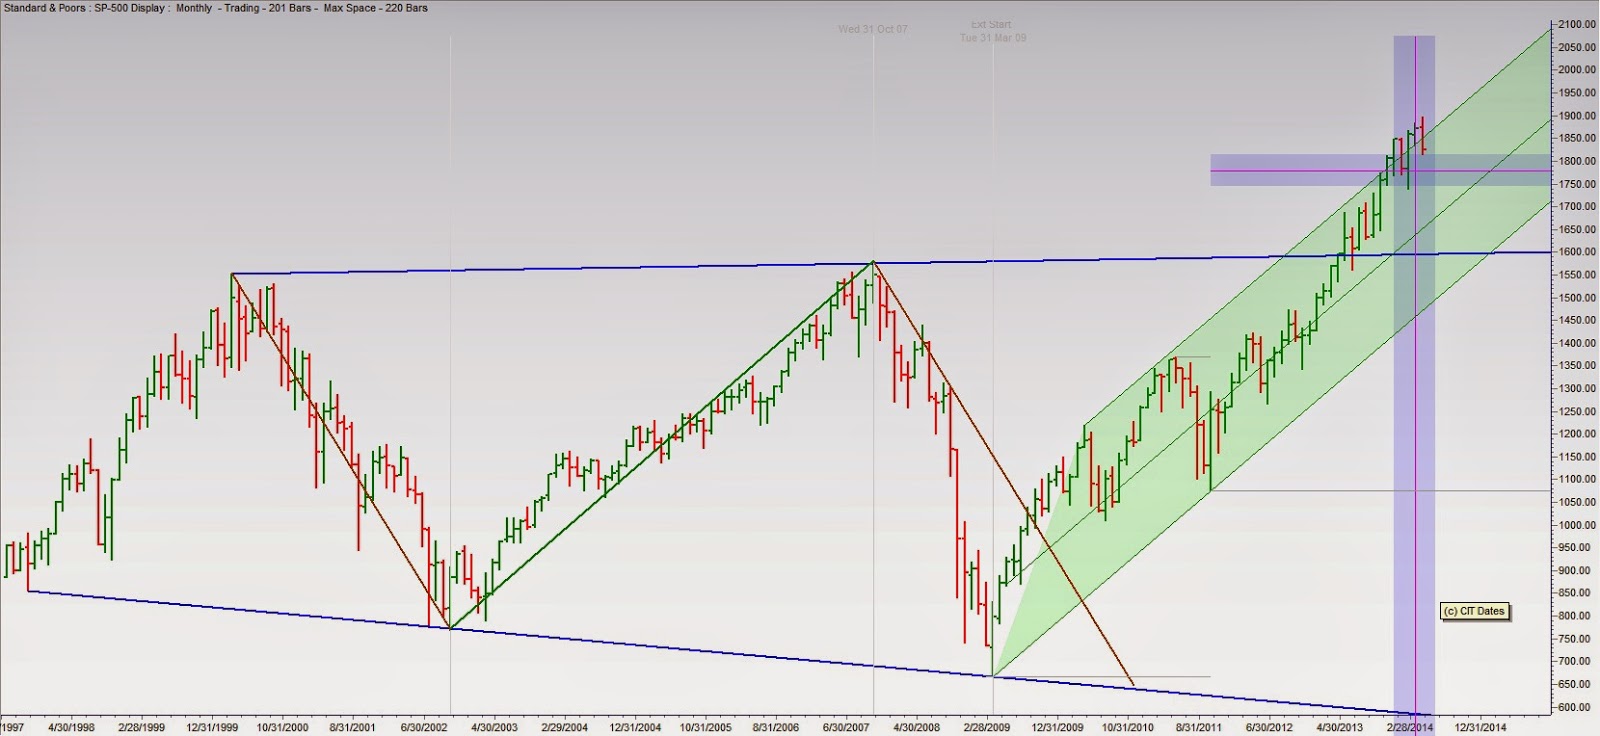
Will Yellen provide the impetus to overcome resistance ?
Market Breadth Data******************************
Wednesday, April 30, 2014
Tuesday, April 29, 2014
$FEYE High-Flyers Common Thread
What do these recent high-fliers: DDD, FEYE, LNKD, MDVN, NFLX, NMBL, NDW, PCYC, SPLK, SSYS, TRIP, TWTR, VEEV, WDAY, ZNGA and ZU
(as reported by BI) have in common ?
OT Signals gave all of them weekly Sell ratings in March:
(as reported by BI) have in common ?
OT Signals gave all of them weekly Sell ratings in March:
Monday, April 28, 2014
Saturday, April 26, 2014
$IMPV The Fly and Tech Stock Carnage
In a recent article BI mentions a list of high beta tech stocks which have suffered severe losses during the last 8 weeks.
We decided to look at them with the default weekly settings of OT Signal in order to find out what signals were triggered during that period.
Here are the results:
ALNY: sell on March 3
BNFT: sell on March 3
CLDX: sell on March 3
CSOD: sell on March 10
DDD: sell of February 24
EXEL: sell on March 3
FEYE: sell on March 3
FUEL: sell on March 3
GIMO: sell on March 24
HALO: sell on February 24
IMPV: sell on March 24
MKTO: sell on March 10
Weekly IMPV with BSH line on top of price and Swing Signals indicator below:
By comparison, during that same period, Wall Street analysts had issued only 2 sell recommendations. One for DDD (compared to 16 buy/hold recommendations), and one for HALO (compared to 6 buy/hold recommendations).
Friday, April 25, 2014
$SPX Seasonality and $AAPL
According to OT Seasonal, this week marks the end of the seasonally strong first half of the year:
AAPL is bumping against strong resistance in the area of the 2013 highs:
AAPL is bumping against strong resistance in the area of the 2013 highs:
Thursday, April 24, 2014
$FB Earnings
Despite stellar earnings, FB's gap up open gets rejected at $64 again:
$64 remains the key level to watch for any bullish potential.
A break above will open the door for a retest of the March '14 highs
$64 remains the key level to watch for any bullish potential.
A break above will open the door for a retest of the March '14 highs
Wednesday, April 23, 2014
Tuesday, April 22, 2014
Monday, April 21, 2014
$QQQ State of the Trend
The divergence continues and, unlike the DJIA:
the Qs and Russell 2000 are still nowhere near close to challenging the recent highs:
the Qs and Russell 2000 are still nowhere near close to challenging the recent highs:
Thursday, April 17, 2014
$SPX and Momentum
Momentum showing a slight divergence with price, just like it did at the beginning of March and April:
$CMG Support/Resistance Levels
$CMG, the undisputed champion of outside reversal days, just loves to trade between support/resistance levels:
$SPX and Momentum
SPX 3-day momentum reaching top of the range:
confirmed by a second set of overbought readings matching the April 1st and 2nd levels:
confirmed by a second set of overbought readings matching the April 1st and 2nd levels:
Wednesday, April 16, 2014
$FB Trend
Despite the three day SPX rebound and break above 1850, and the fact that this is one of the strongest weeks for the major indices (from a seasonal point of view), Russell remains in the doldrums:
and recent mo-mo stocks like FB, PCLN, NFLX, CMG haven't even begun to recover yet:
and recent mo-mo stocks like FB, PCLN, NFLX, CMG haven't even begun to recover yet:
$XLU Leading the Way
Utilities, as a group, are breaking out to new highs:
WEC, CMS, NU, GAS, XLU
suggesting investors are not that worried about rising interest rates.
WEC, CMS, NU, GAS, XLU
suggesting investors are not that worried about rising interest rates.
Tuesday, April 15, 2014
$DTE and SBMY Scan Results
Yesterday's scan shows that DTE is the SP500 stock in the longest upswing:
while BMY is leading to the downside:
while BMY is leading to the downside:
Monday, April 14, 2014
Saturday, April 12, 2014
$SPX with Bulls and Bears
Currently, bulls and bears are evenly divided, which suggests choppy trading in the days ahead until one side clearly prevails and leads to an overbought (extreme greed) or oversold (extreme fear) market:
VIX puts the downside potential in perspective, and shows how significant it could be:
VIX puts the downside potential in perspective, and shows how significant it could be:
$SPX and $DJIA Trend and Support Levels
The SPX has a convergence of daily, weekly and monthly support levels at 1790 - 1800:
The equivalent for the DJIA is around 15,600:
The equivalent for the DJIA is around 15,600:
Friday, April 11, 2014
$QQQ and $SOX Trend and Channels
Qs targeting the next support/reversal level:
while SOX has broken below the median line and is targeting the lower channel line:
while SOX has broken below the median line and is targeting the lower channel line:
Subscribe to:
Posts (Atom)
Terms of Use
All rights reserved by the author. The material contained herein is original content and is the sole property of the author. Any commercial use or reproduction - either in part or whole - is strictly forbidden without the author's prior consent.
Disclaimer: The information provided here is for educational purposes only and does not constitute trading advice nor an invitation to buy or sell securities. The views are the personal views of the author. Before acting on any of the ideas expressed, the reader should seek professional advice to determine the suitability in view of his or her personal circumstances.


