
Friday, October 30, 2015
$QQQ Gap History
Since inception the Qs have had only 6 gaps of equal or bigger magnitude, all in the '99 - '02 period. All of them got filled within two weeks:


Thursday, October 29, 2015

Wednesday, October 28, 2015

$UNG Gap Update
In less than 24h the gap was exceeded by a wide margin:

and now is waiting to get filled on the downside.

and now is waiting to get filled on the downside.
$FXF Waiting to Exhale
The USD has been acting very strongly lately against the CHF, and has exceeded both the average upswing price and time targets. Currently bumping against strong resistance between .9875 & .99. The slightest disappointment from the Fed today can throw this in reverse. Average dowside swing target @ .9675:


Tuesday, October 27, 2015
$UNG Bounce
Despite a falling rig count since 2008, natural gas prices have been declining steadily for the last 7 years. Currently NG is testing the 2012 lows and offers a good risk/reward opportunity for at least a short-term long trade:


On the daily chart there's a gap at the 2.22 - 2.28 level that's practically begging to get filled:

Monday, October 26, 2015
$FXY Continuing Consolidation
The narrowing of monthly CIT Bars suggests that momentum is waning and the pair has entered a period of
consolidation which can last several more months. The trend remains up until the
CIT Pivot at 116 is broken. Still plenty of room for short-term swing trading
between 116 and 125:


#SPY and FOMC Meetings
Recent FOMC meetings and member's statements have delivered contradictory messages and resulted in mixed but strong market reaction:

Two things to keep an eye on: gap zones and angle support.

Two things to keep an eye on: gap zones and angle support.
Saturday, October 24, 2015


Friday, October 23, 2015
$SPY Pattern and Trend
The good news is that the uptrend continues, and the SP500 even went briefly into the plus column for the year:

The bad news is that there are a couple of large gaps waiting to get filled.
First support level @ 2064, then 2053; first resistance level @ 2080.

The bad news is that there are a couple of large gaps waiting to get filled.
First support level @ 2064, then 2053; first resistance level @ 2080.
Thursday, October 22, 2015
$SPY Price Target Update
SP500 closed .5 points above the daily target and continues advancing after hours. Channel support holds, and the next cluster of resistance levels comes just above 2100:

Market breadth osc. not overbought yet:


Market breadth osc. not overbought yet:

$SPY Key Support/Resistance Level
SP500 taking a stab at key support/resistance level at 2042.8 in a series of higher highs and higher lows:

High target for the day: 2052

High target for the day: 2052
Wednesday, October 21, 2015

Tuesday, October 20, 2015
$SPY and Momentum
Make or break time for the SP500 which is stalling just below the 100 dma and resistance:


Monday, October 19, 2015
$SPY and Market Breadth
The Market Breadth oscillator has a long way to go before getting overbought:


$SPY Pattern and Trend
Despite minor fluctuations and deviations from the Oct '14 pattern, the outlook remains bullish as long as price remains above the trend line:


Sunday, October 18, 2015
$SPY and Market Timing
OpEx dates (vertical lines) along with Moon phases (black and white arrows) have a pretty good track record of signaling the beginning and end of price swings:


Saturday, October 17, 2015
$QQQ In Pole Position
From a technical point of view, the Qs are leading the pack and in strongest position among the major averages, followed by SPY, DIA and IWM:


Friday, October 16, 2015
$GLD Buzzing with Excitement
The gold bug community is buzzing with excitement once again, although there's no evidence, so far, that this oversold bounce will be any different from the previous ones:


Thursday, October 15, 2015
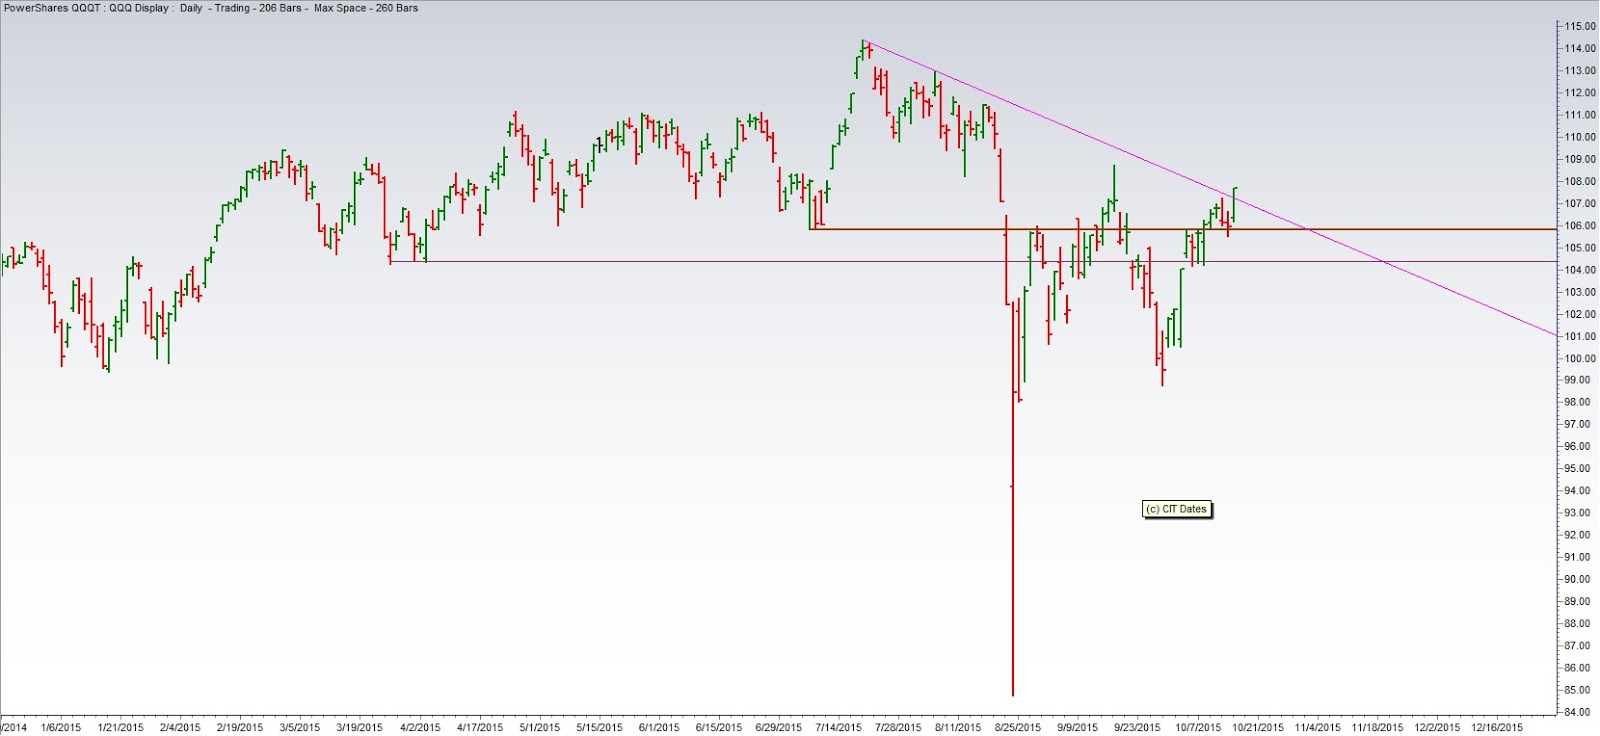
$QQQ Pattern and Trend Update
Of the four major averages (QQQ, DIA, SPY, IWM) only the Qs are trading above the July lows, and they just broke above a key resistance line:

Wednesday, October 14, 2015
$SPY and Market Breadth
Market breadth has a very good track record of preceding or coinciding with price turns:

and both market breadth and price cycles are similar in length and duration:

The SPY chart shows a sizable gap between 195 & 196.3 waiting to get filled :


and both market breadth and price cycles are similar in length and duration:

The SPY chart shows a sizable gap between 195 & 196.3 waiting to get filled :

Tuesday, October 13, 2015

Monday, October 12, 2015
$SPY Rolling Correction
So far, a case can be made for a rolling correction. where the market breadth cycle goes through a downturn, while the index moves sideways/up:

At the current rate, market breadth has two more days before getting oversold, but recent history shows that things can spin out of control rather quickly.

At the current rate, market breadth has two more days before getting oversold, but recent history shows that things can spin out of control rather quickly.
Saturday, October 10, 2015
$SPY And The Case Of The Missing...
... Fractal ?

The 8 td Sep. - Oct.'15 rally was an exact replica of the Oct. '14 rally. A continuation of the uptrend hinges on keeping the average above the rising angle.

The 8 td Sep. - Oct.'15 rally was an exact replica of the Oct. '14 rally. A continuation of the uptrend hinges on keeping the average above the rising angle.
Thursday, October 08, 2015

Wednesday, October 07, 2015
$SPY and MA Cross
No monthly ma cross so far. For this to continue to be the case, the index needs to stay within the current channel:


Tuesday, October 06, 2015
$SPY Bulls and Bears
Bulls & bears are evenly matched at current levels which usually results in a string of whipsaws until one side prevails:


Monday, October 05, 2015

Saturday, October 03, 2015
$SPY and Sentiment Readings
The sentiment indicator is swinging back in overbought territory:

a positive sign only at the beginning of a new bull run.

a positive sign only at the beginning of a new bull run.
Friday, October 02, 2015

Subscribe to:
Posts (Atom)
