Market Breadth Data******************************

Friday, December 29, 2017

SPX Pattern and Trend

The index finished the year just 1% above our high target.

And now it's time to post the parameters for 2018:


The eight year of the decennial cycle is generally positive, although every 30 years there are signs of weakness or under-performance. 2008 being the most prominent example.


Tuesday, December 26, 2017

2017 Recap

In January '17 we published our roadmap for 2017 and, once again, the SPX didn't disappoint. It followed the 1 x 1 angle for most of the year:


until it overshot our upside target by 1.8% in December (just like it did in 2016).

The key resistance line, for various reasons, remains 2685.

Saturday, December 09, 2017

Seasonality

From a seasonal point of view, one of the weakest and one of the strongest weekly seasonal periods are just ahead of us:


Chart courtesy of OT Seasonal.

Monday, December 04, 2017

SPX Pattern and Trend

Monday's price action has sell the news written all over it:

Weekly support @ 2560, daily support @ 2600, resistance at the uptrend megaphone line.

Tuesday, November 28, 2017

SPX Pattern and Trend

Nothing like the threat of a government shutdown to spark a breakout to new highs:

and to mark the end of the 5 days sideways move.

Wednesday, November 22, 2017

SPX Pattern and Trend

Market breadth got overbought, as expected:


which, usually, precedes a sideways/down phase.

The futures closed right at resistance:


Tuesday, November 21, 2017

SPX Pattern and Trend

The futures have closed within a narrow 40 point range since mid October:

A break below the range will probably be bought by dip buyers, expecting a year-end rally.

A strong up day today will result in overbought market breadth readings.

Thursday, November 16, 2017

SPX Pattern and trend

The key pivot line at 2565.5 held one more time, and the index is back within the uptrend channel:


Channel support at 2578.5, key support at 2565.5
Market breadth bouncing off oversold levels:


Wednesday, November 15, 2017

SPY Pattern and Trend

The futures are testing the key 2565.5 level for the forth time this month:


The more this level get's tested, the weaker it gets. A break below is likely to lead to a sizable sell-off and a new down-trend. Lower support levels at 2550 and 2544.

Market breadth is hovering just above recent oversold levels:


Monday, November 13, 2017

$SPY Pattern and Trend

Day 3 of the pull-back and second inside day for the e-mini:


The Nov 9th candle identifies the key support/resistance and breakdown/breakout levels: 2565.5 and 2597 respectively.

The e-mini is showing preliminary signs that a new trend channel may be developing.

Thursday, November 09, 2017

$SPY Pattern and Trend

Time-wise, the sell-off came right on cue


Despite the vicious intraday drop, the futures managed to close within the channel, leaving the uptrend still in place.

Channel support at 2582, angle support at 2572.5, trend support at 2566.

The most recent sell-offs have lasted between 1 and 3 days.

Monday, November 06, 2017

$SPY pattern and Trend

The futures continue climbing the wall of worry following the trend reversal on 08.21.17:


Channel support at 2578, resistance and breakout level at 2588, upside target at 2620/40.

Wednesday, November 01, 2017

$SPY Pattern and Trend

Despite weakness in the middle of last week, the futures regained the uptrend channel:


First resistance/breakout level at 2583, channel support at 2573.5

Wednesday, October 25, 2017

$SPY Pattern and Trend

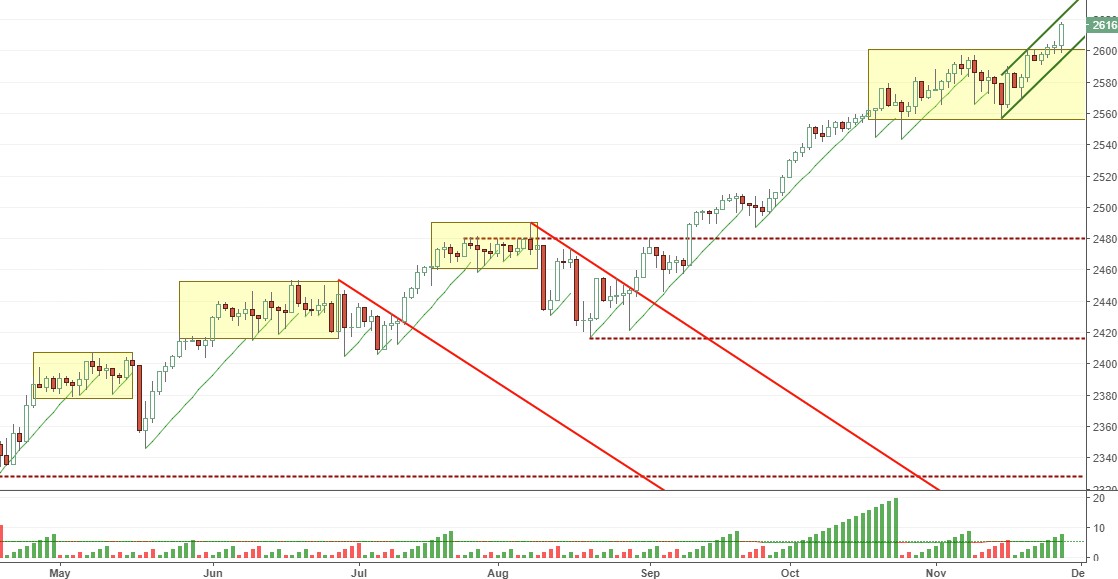
The futures are starting the day by testing channel support:


We already mentioned the similarities with Feb-Mar '17.
Lower support levels at 2554 and 2540.
Note that the CIT Time indicator at the bottom is turning bearish.

Monday, October 23, 2017

Market Breadth

Market breadth is peaking at levels associated with overbought readings in the recent past:


Saturday, October 21, 2017

$SPY Pattern and Trend

Strong momentum propelled the futures to new highs on Friday:


Weekly channel upside target at 2580, Sq9 support/resistance levels at 2550/2595.
Pivot line at 2560.

SPY painted a classic hammer candlestick and, time-wise,  the current upswing is getting overextended, showing some similarities with Feb-Mar '17:


Wednesday, October 18, 2017

$SPY Pattern and Trend

So far, short opportunities have been few and far between in 2017, and shallow pull-backs have presented better long entry points:


Tuesday, October 17, 2017

$DIA Momentum

DJIA quarterly momentum readings going back to 1950:


The historical perspective shows that momentum can run strong for prolonged periods of time.

Saturday, October 14, 2017

$SPY Pattern and Trend

The index came within a quarter of a point from our weekly upside target of 255.5, and the trend remains up:


Next week's upside target is 256, pivot line at 254.65

Market breadth has hit rock bottom which, after the bottoming process is done, usually precedes higher prices:


Wednesday, October 11, 2017

Tuesday, October 10, 2017

$SPY Pattern and Trend

The week started with a third inside day (compared to Wednesday, 10.4.17), with the index trading above the trend-line and pivot bars:


For swing traders, the High and Low of 10.4.17 define the short-term long/short breakout levels to watch.

Sunday, October 08, 2017

SPY Pattern and Trend

The week finished with an inside day, slightly exceeding the upside target. The daily trend remains up, the new upside target moved to 255.5:


The pivot line is at 253, and support at 251.

There are signs of weakening in trend and momentum readings:


Bullish sentiment decreased slightly despite rising weekly prices:


Thursday, October 05, 2017

SPY Pattern and Trend

Despite lingering concerns about market breath, the futures continue trading above the channel and are pointing to a higher open:


Channel support at 2535.

Wednesday, October 04, 2017

$SPY Pattern and Trend

The negative divergence, developing between price and market breadth after a prolonged upswing, should be a reason for concern:


Saturday, September 30, 2017

$SPY Pattern and Trend

A true breakout or end of quarter window dressing ?


We'll have the answer next week.

For the time being, the trend remains up, and the upside weekly target moved to 253.5
Pivot line at 249.7, support at 249 and 247.4.

Market sentiment remains positive, currently approaching overbought levels:


Trend and momentum readings are maxed out:


Saturday, September 23, 2017

SPY Pattern and Trend

After being pinned to the top for six straight days, with little to show for, in terms of price gains, Trend and Momentum are taking a well deserved breather:


while VIX continues racing to the bottom.

Key support at 2490.
Daily pivot at 2495, weekly at 2470.

Wednesday, September 20, 2017

SPY Pattern and Trend

The index is pushing on a string waiting for the Fed and the tax reform proposal, which is keeping downside pressure in check:

The daily pivot line is at 2499 with two unfilled gaps underneath. The trend and momentum readings continue to be maxed out.

Sunday, September 17, 2017

$SPY Pattern and Trend

The index finished opex week pinned at its first upside target of 250/2500:


The combined trend and momentum readings are at their maximum level suggesting that a sideways/down phase is to follow:


Daily pivot @ 2495, weekly @ 2492.
All eyes on the FED.

Tuesday, June 13, 2017

$SPY Pattern and Trend

If the symmetry continues to hold, expect a swing low mid September, and rally until April/August '18:

SPX price target 2500 - 2510.

Monday, June 12, 2017

$QQQ Pattern and Trend

The Qs found support at the 50 dma and the % decline is consistent with previous corrections in an uptrend:


Sunday, June 11, 2017

$QQQ Pattern and Trend

The uptrend hasn't been broken yet, as the Qs declined exactly to the 50% retracement of the last upswing:


This was a good example, however, of what to expect once everybody rushes for the exit at the same time.

Friday, June 09, 2017

Thursday, June 08, 2017

$SPY Pattern and Trend

The index is at a critical juncture, deciding whether to stay with the current and, eventually, retesting the lower channel line, or accelerating upwards and establishing higher support/resistance levels:

Wednesday, June 07, 2017

$SPY Pattern and Trend

The SPX is testing the breakout channel, trading below the 1 x 1 angle


Sunday, June 04, 2017

$DIA and Bull Rallies

Since the DJIA made a new high last Friday, here's an update of the historical rallies table:


The current rally is 375 days short of the longest rally in history, and ranks #5 in terms of % gain.


Only two rallies out of 28 have topped in May or June.


Friday, June 02, 2017

$SPY Waves, Momentum and Trend

Daily market breadth suggests that the sideways/down phase is over, and there's plenty of upside potential left:


Also, the short-term upswing exceeded the length of the preceding downswing, meaning that we are currently in week 30 of the larger trend which remains up:


This is the latest leg of the bullish wave pattern which started in 2009:


From this perspective, we've already exceeded the length (58 weeks) of the first leg of that pattern.

Terms of Use

All rights reserved by the author. The material contained herein is original content and is the sole property of the author. Any commercial use or reproduction - either in part or whole - is strictly forbidden without the author's prior consent.

Disclaimer: The information provided here is for educational purposes only and does not constitute trading advice nor an invitation to buy or sell securities. The views are the personal views of the author. Before acting on any of the ideas expressed, the reader should seek professional advice to determine the suitability in view of his or her personal circumstances.