Market Breadth Data******************************

Thursday, October 26, 2006


These are the November CIT dates.

My working hypothesis is simple:
- we keep grinding higher until Friday, November 3rd, consolidating along the way;
- this is followed by a real correction (as opposed to a mere consolidation) November 7 – 13th,
- a dead cat bounce November 13-14th, and a new slide until the 22nd.

Sunday, October 22, 2006


The SPX started and finished the week closing at 1369.
So 1369 proved to be an important level after all.

The calendar day chart above shows interesting relationships.

The 2 trendlines in grey demonstrate that the SPX 1369 level squares perfectly with the January ’03 highs, while the July 18th low squared with the March 12th, 2003 low.
Is there some other hidden relationship between these two sets of dates?
Consider this: the 2003 swing low lasted 58 days. The current swing is 98 days old (98 = 58 * 1.618).

Any other interesting coincidences?
Plenty...

From 03/24/00 to 07/24/02 = 852 CD’s; 852 * 1.786 = 1522;
08/22/02 + 1522 = 10/21/06

From 03/24/00 to 08/22/02 = 881 CD’s; 881 * 1.5 = 1322;
03/13/03 + 1322 = 10/23/06


From 03/24/00 to 10/10/02 = 930 CD’s; 930 * 1.618 = 1379;
01/13/03 + 1379 = 10/22/06


From 03/24/00 to 12/02/02 = 983 CD’s; 983 * 1.5 = 1475;
10/10/02 + 1475 = 10/23/06

Where does that bring us ?
Back to 1369.
It is still the key level to watch.
The other support and resistance levels are pretty clearly defined as well.

By the way, although I expect a pull-back next week, I don’t agree with Crawford’s immediate crash scenario. My broad market overbought/oversold indicator is reaching oversold levels. At this rate the bottom should be reached around the 24th – 25th, which is also my next CIT date. In my experience with this particular indicator, you can’t expect market crashes from oversold levels, nor major break-outs from overbought readings.

Saturday, October 14, 2006


OK, time for a quick update....

We got the choppy move and a new swing high.
The question is -- where do we go next?

Without going into too much detail, I’ll just point out some key factors.
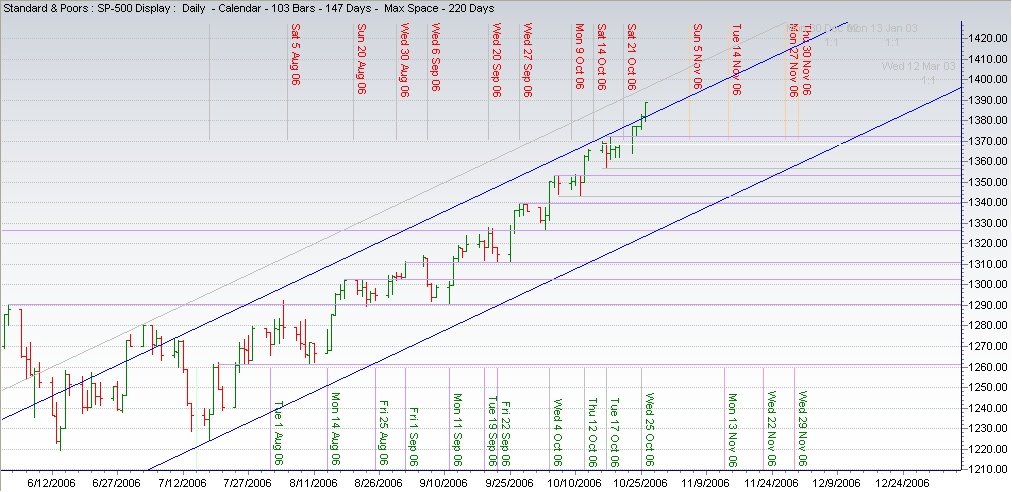
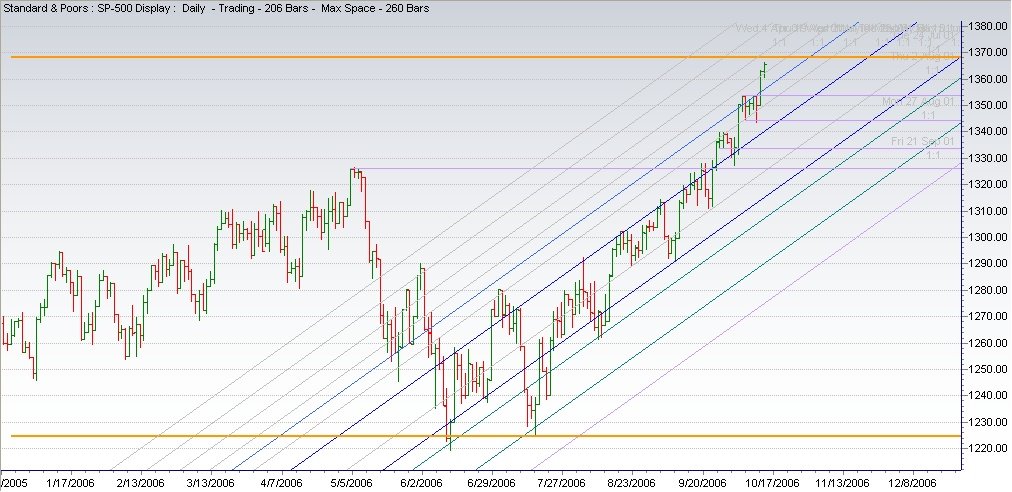
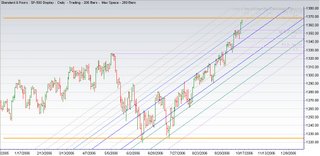
The SPX is at the top of the weekly channel published on September 23rd.
There is an important Gann Sq9 level right above at 1369, which also happens to be exactly 360 degrees up from the July 18th low (orange lines). This should roughly coincide with Dow 12000. Support is well defined by Gann Zero Lines and prior support/resistance levels.

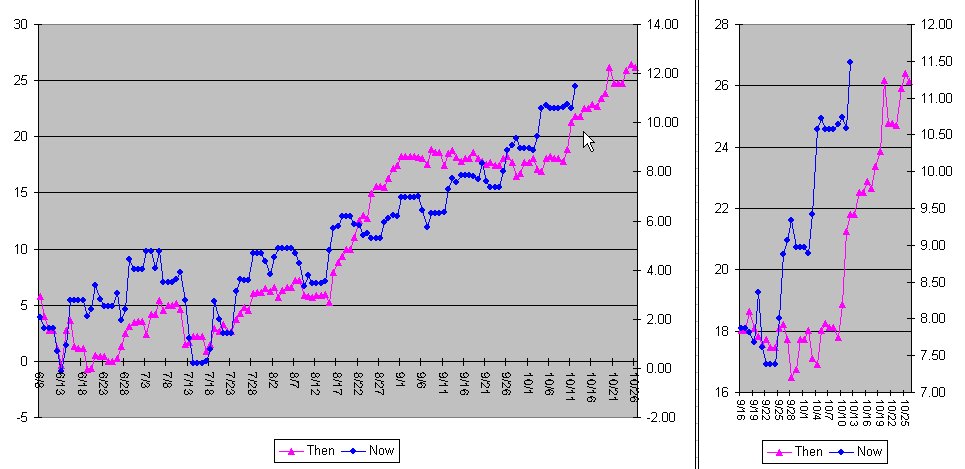
A look back in history may provide us with a glimpse of the future. The chart below depicts a .89 correlation between the DJIA now and many years ago, when the markets were open on Saturday (it drops to .8 for the period January - October).


Terms of Use

All rights reserved by the author. The material contained herein is original content and is the sole property of the author. Any commercial use or reproduction - either in part or whole - is strictly forbidden without the author's prior consent.

Disclaimer: The information provided here is for educational purposes only and does not constitute trading advice nor an invitation to buy or sell securities. The views are the personal views of the author. Before acting on any of the ideas expressed, the reader should seek professional advice to determine the suitability in view of his or her personal circumstances.