OK, time for a quick update....
We got the choppy move and a new swing high.
The question is -- where do we go next?
Without going into too much detail, I’ll just point out some key factors.
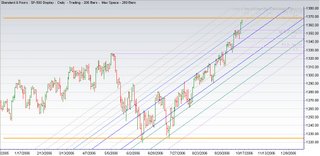
The SPX is at the top of the weekly channel published on September 23rd.
There is an important Gann Sq9 level right above at 1369, which also happens to be exactly 360 degrees up from the July 18th low (orange lines). This should roughly coincide with Dow 12000. Support is well defined by Gann Zero Lines and prior support/resistance levels.
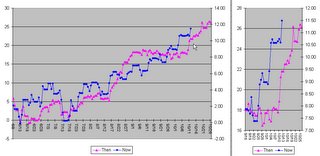
A look back in history may provide us with a glimpse of the future. The chart below depicts a .89 correlation between the DJIA now and many years ago, when the markets were open on Saturday (it drops to .8 for the period January - October).
