The SPX started and finished the week closing at 1369.
So 1369 proved to be an important level after all.
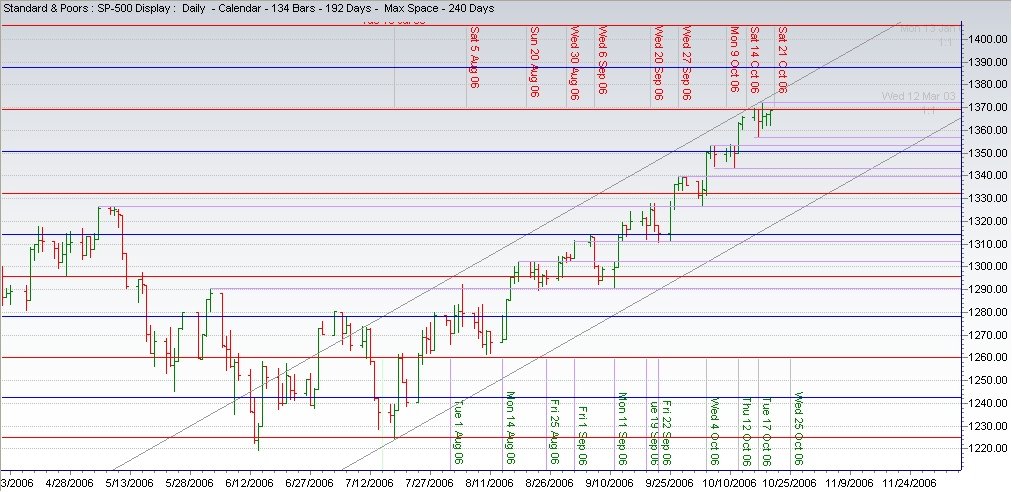
The calendar day chart above shows interesting relationships.
The 2 trendlines in grey demonstrate that the SPX 1369 level squares perfectly with the January ’03 highs, while the July 18th low squared with the March 12th, 2003 low.
Is there some other hidden relationship between these two sets of dates?
Consider this: the 2003 swing low lasted 58 days. The current swing is 98 days old (98 = 58 * 1.618).
Any other interesting coincidences?
Plenty...
From 03/24/00 to 07/24/02 = 852 CD’s; 852 * 1.786 = 1522;
08/22/02 + 1522 = 10/21/06
From 03/24/00 to 08/22/02 = 881 CD’s; 881 * 1.5 = 1322;
03/13/03 + 1322 = 10/23/06
From 03/24/00 to 10/10/02 = 930 CD’s; 930 * 1.618 = 1379;
01/13/03 + 1379 = 10/22/06
From 03/24/00 to 12/02/02 = 983 CD’s; 983 * 1.5 = 1475;
10/10/02 + 1475 = 10/23/06
Where does that bring us ?
Back to 1369.
It is still the key level to watch.
The other support and resistance levels are pretty clearly defined as well.
By the way, although I expect a pull-back next week, I don’t agree with Crawford’s immediate crash scenario. My broad market overbought/oversold indicator is reaching oversold levels. At this rate the bottom should be reached around the 24th – 25th, which is also my next CIT date. In my experience with this particular indicator, you can’t expect market crashes from oversold levels, nor major break-outs from overbought readings.
